A PI Vision display is quick to build. A set of dashboards that stays useful across many assets, sites and years takes a few decisions up front. These practices are based on the AVEVA documentation and on our experience with PI Vision projects.
New to PI Vision? Start with our AVEVA PI Vision guide.
Build on PI AF
AVEVA recommends PI Asset Framework to get the most from PI Vision. Displays built on AF elements and templates can be reused for every asset of the same type, while displays built on single PI points have to be copied and maintained one by one. Our PI Asset Framework guide explains templates and attributes.
One display for many assets
With asset swap, users switch a display from one asset to another. By default, the asset list shows all assets created from the same template as the assets in the display. If an asset is not based on the same template and lacks an attribute, the display shows No Data; if an attribute is excluded on an asset of the same template, it shows N/A or a blank. Configure the multi-state of a symbol to hide bad data in such cases.
Collections for fleets of assets
Collections group similar assets in one display and add new assets automatically (AVEVA), for example all pumps of a unit. Since PI Vision 2017 R2, the search root of a collection can follow the related assets menu, so one collection display serves several areas.
Status at a glance
Multi-state symbols, tables and graphics change color or blink when values cross thresholds you define, and event tables show events next to the process data. Use a consistent color scheme across displays, so a red state means the same everywhere.
Calculations: know where they run
PI Vision 2020 introduced calculations on PI points in displays, and PI Vision 2021 added AF attributes, which also work with asset swap and collections. According to AVEVA’s PI Vision performance session, tag-based calculations run on the PI Data Archive and asset-based calculations on the PI Vision server, and extensive use of calculations is a common cause of slow displays. Results that many displays need belong in AF analyses instead.
Keep displays fast
The same AVEVA session lists the possible bottlenecks: client browser, network, PI AF server, PI Data Archive, the PI Vision application and the web server. Keep displays focused, avoid very long time ranges on dense trends, and check the data underneath: poorly tuned exception and compression settings also slow displays down, as our PI Tag Optimization page explains.
Organize and govern displays
PI Vision 2024 added moving folders and a permissions model for folders and displays, and the 2025 Display Utility can assign the Manage permission (PI Vision 2025 release notes). Use folders per site or team, separate development folders from published ones, and keep a change history: reVision keeps a revision history of PI Vision displays and restores earlier versions.
Events in the display with the PI Vision Suite
Event frames are where PI AF records what happened on an asset: downtime, excursions, batches (see our PI Asset Framework guide). The PI Vision Suite brings them into the display where people already work.
- Gantt chart: shows the AF event frames of the displayed time range, grouped by event type. Hovering over an event shows its start, end, duration, severity and the attributes you configure.
- Event Viewer: lists the events in a table where users acknowledge, comment on, edit and review event frames, and create new ones on the fly, for example to record a downtime reason during a shift.
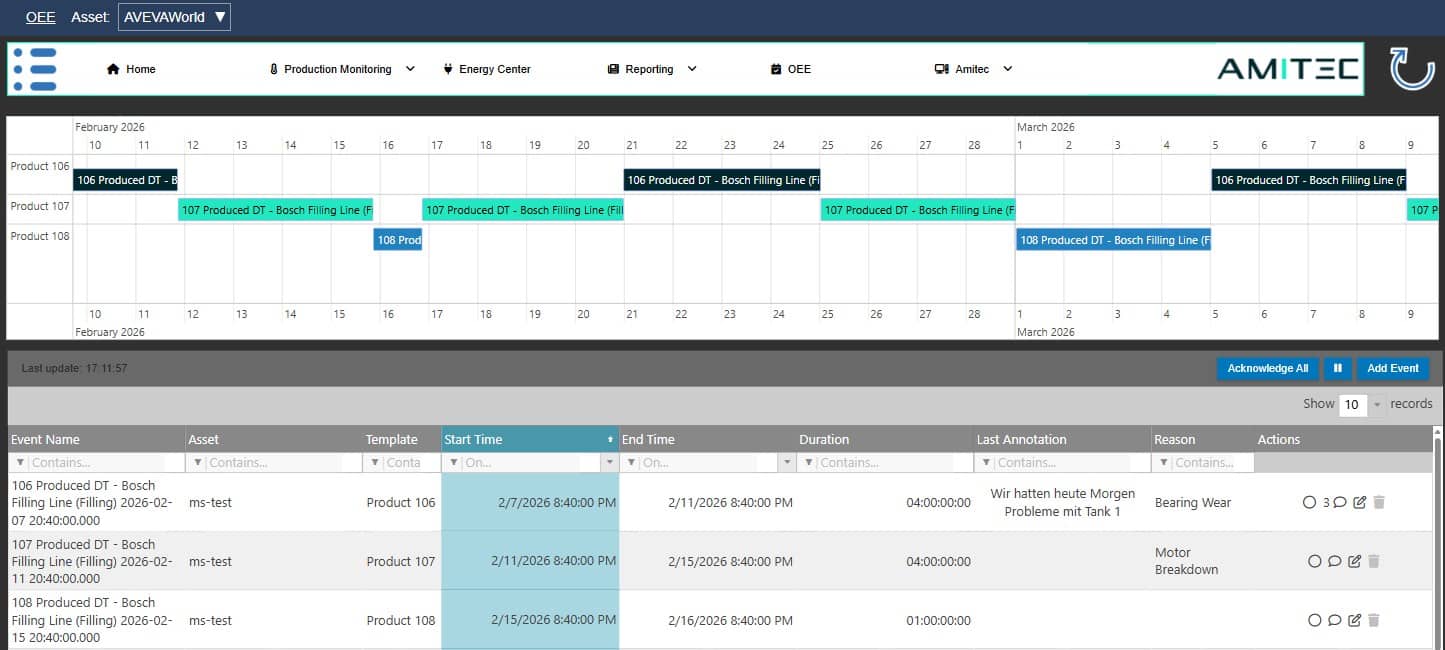
OEE display in AVEVA PI Vision with three PI Vision Suite symbols: the Navigation Menu at the top, the Gantt chart of production events and the Event Viewer with reasons, comments and actions. Click to enlarge.
Assets at a glance with the PI Vision Suite
With many assets, the first question is often where something is happening. The PI Vision Suite answers it in the display:
- Map: places AF elements on a map and shows their live status with custom icons, colors and status indicators, so a fleet of sites or vehicles fits on one screen.
- Comparison symbols: doughnut charts, stacked bars and the calendar heatmap put assets or energy sources side by side and make recurring patterns visible.
- Navigation Menu: built from an AF element structure based on templates, it puts the same menu on top of every display of a site, so users move between assets and displays without searching.
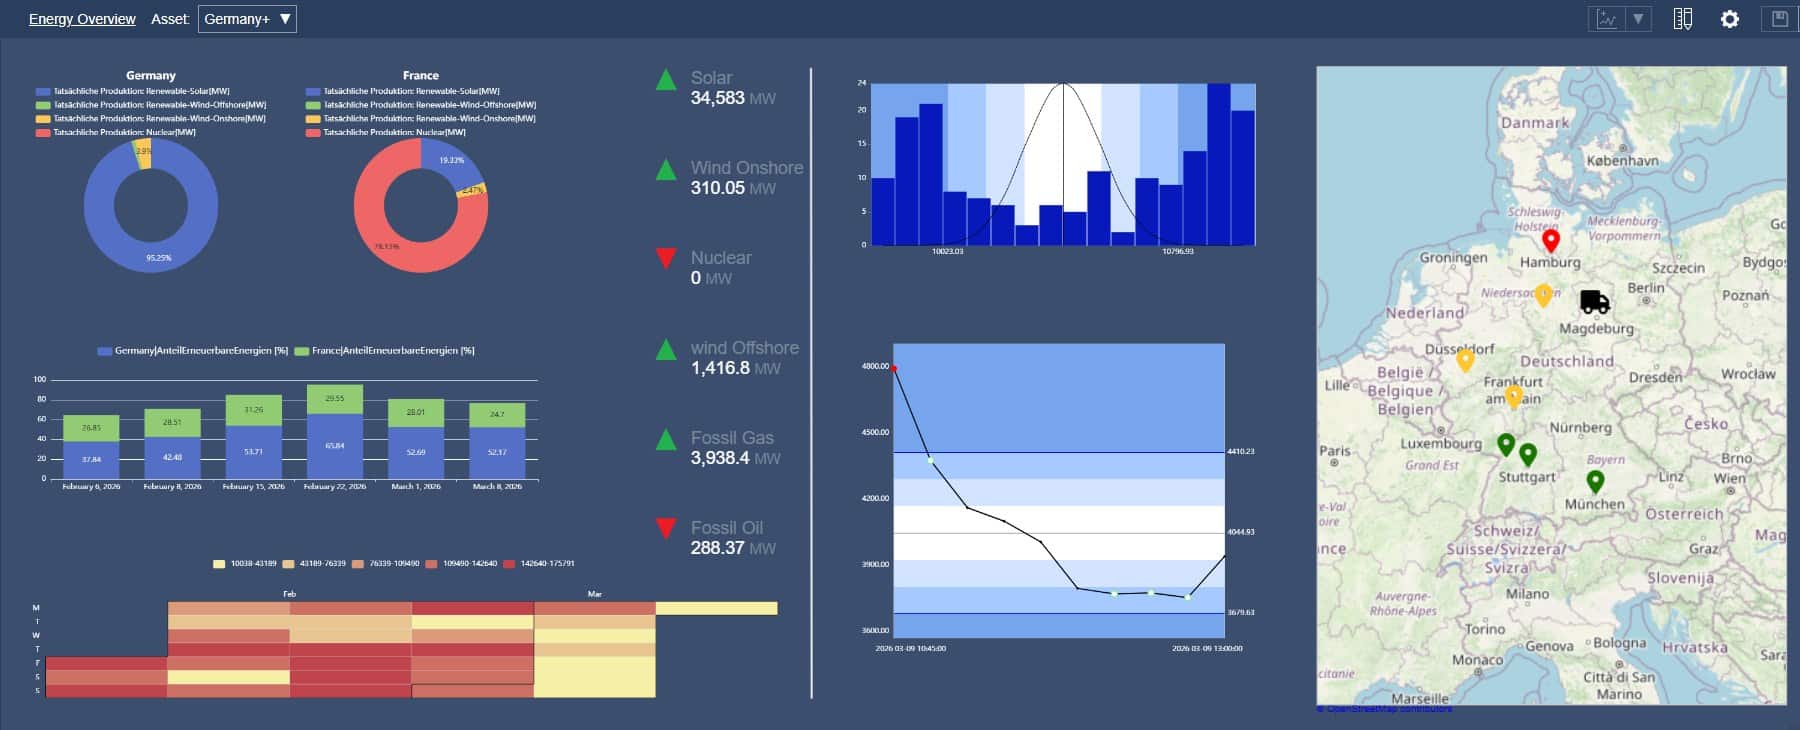
Energy overview in AVEVA PI Vision built with PI Vision Suite symbols: doughnut charts, stacked bars and a calendar heatmap compare countries and energy sources, the Map symbol shows sites with their live status. Map data: OpenStreetMap contributors. Click to enlarge.
Symbols beyond the standard set
When the built-in symbols are not enough, the Amitec PI Vision Suite adds 41 custom symbols and 8 tools to AVEVA PI Vision, for example Sankey diagrams, calendar heatmaps, radar charts, stacked bars, maps and a date picker. Read how PI Vision custom symbols work.
Frequently asked questions
How do I make one PI Vision display work for many assets?
Build it on PI AF elements that share a template, then use asset swap. The asset list shows all assets created from the same template by default.
What is a PI Vision collection?
A collection groups similar assets in one display and adds new assets automatically, for example all pumps of a unit.
Why does my display show No Data after switching assets?
The new asset is not based on the same template and lacks the attribute. Assets with an excluded attribute show N/A or a blank instead.
Why is my PI Vision display slow?
Common causes are many calculations, dense trends over long time ranges and slow data sources. AVEVA lists browser, network, PI AF, PI Data Archive, the PI Vision application and the web server as possible bottlenecks.
How can we track changes to PI Vision displays?
PI Vision itself offers folders and permissions. For version control with a revision history and restore, use reVision.
Related posts
How PI Vision custom symbols work, the rules of the extensibility framework, and when a ready-made add-on such as the PI Vision Suite saves the work.
How to build ISO 50001 energy performance indicators and energy baselines from AVEVA PI data, and where energy:center automates the work.
What AVEVA PI Vision is, how it is installed, the current release, licensing with AVEVA Flex credits, the move from PI ProcessBook and how to extend PI Vision.